
If you’re running availability groups it may seem like a great idea to offload your read only reporting workloads to a secondary. There are a couple of ways that you could do that, you could use read only routing or simply just point those reports directly at a read only secondary (read only routing is probably the best way to achieve this but that’s something for a different post).
And why not? Reporting workloads can be very resource intensive so it seems like a great idea to get those queries away from your OLTP workloads. And in the most part this works brilliantly but, and there’s always a but isn’t there…
The ‘but’ here is redo latency and it was the cause of an incident that I recently saw crop up.
There’s a misconception that if you have a synchronous replica, that replica has to commit any transactions that are passed to it by the primary before the primary can then commit those same transactions. This ensures that there is no possibility of data loss and that the data would always be available on the secondary.
With this misconception comes our problem.
While a synchronous secondary node does guarantee zero data loss (on the most part, check out Availability Groups: When Your Synchronous Secondary isn’t Synchronous for when this may not be the case) it doesn’t guarantee that the data will be instantaneously available on the secondary node.
This is due to the way that the AG redo process actually works. Our primary won’t actually wait for the transaction to be committed on the secondary but instead only for the log entry to be hardened. This meets our requirement for zero data loss but this subtle difference can mean that the result of the transaction won’t necessarily be reflected straight away in the secondary tables.
There’s a separate redo process which runs independently of the AG replication and is responsible for redoing those log entries that have been sent across to the secondary database. It’s only after this redo process runs, will we be able to see the data changes on our secondary node.
Let See This In Action
We can see this in action fairly easily.
I’ve created a table called ‘latencytest’ that I’m going to insert values into every 10 seconds.
create table dbo.latencytest
(guid UNIQUEIDENTIFIER)
I’ve written a PowerShell script that’s going to deal with inserting the data and print a timestamp that each INSERT completes.
##Load the assembly.
[reflection.assembly]::loadwithpartialname("Microsoft.SqlServer.Smo") | out-null

$conn=new-object System.Data.SqlClient.SQLConnection
$ConnectionString = "Server=SQL01;Integrated Security=SSPI;"
$conn.ConnectionString=$ConnectionString
$conn.Open()

$srv = New-Object ('Microsoft.SqlServer.Management.Smo.Server') $conn

while (1 -eq 1)
{
    $databases = $srv.Databases["SQLUndercover"].ExecuteNonQuery("INSERT INTO dbo.latencytest VALUES (NEWID())")
    write-host $(Get-Date -Format "hh:mm:ss.ffffff")

    Start-Sleep -Seconds 10
}
At the same time that that’s running, I’m also going to run the following PowerShell script which will detect a new row appearing on the secondary and print the timestamp of when that happens.
##Load the assembly.
[reflection.assembly]::loadwithpartialname("Microsoft.SqlServer.Smo") | out-null


$conn=new-object System.Data.SqlClient.SQLConnection
$ConnectionString = "Server=SQL02;Integrated Security=SSPI"
$conn.ConnectionString=$ConnectionString
$conn.Open()


$srv = New-Object ('Microsoft.SqlServer.Management.Smo.Server') $conn
$databases = $srv.Databases["SQLUndercover"].ExecuteWithResults("SELECT guid FROM dbo.latencytest")

#set initial row count number
$count = $databases.Tables[0].Rows.Count
$latestcount = $count


while (1 -eq 1)
{
    #loop through until a new row is detected
    while ($latestcount -eq $count)
    {
    $databases = $srv.Databases["minion"].ExecuteWithResults("SELECT guid FROM dbo.latencytest")
    $latestcount = $databases.Tables[0].Rows.Count
    }
    write-host $(Get-Date -Format "hh:mm:ss.ffffff")

    $count = $latestcount
}
Comparing the timestamps was quite interesting….
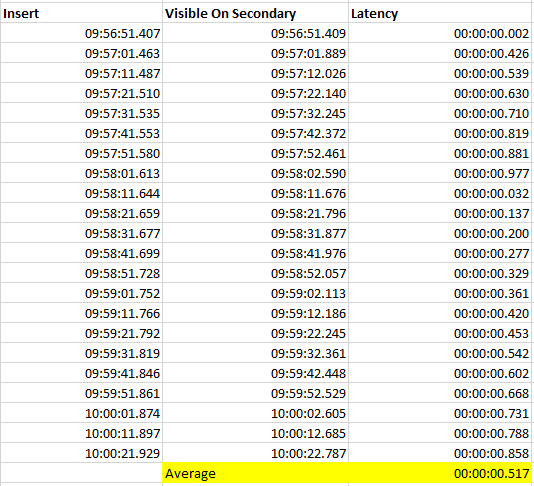
The difference was very variable but averaged out at around 0.5 seconds.
Control Test
But how accurate was that, how much of that latency was really due to the redo and how much came down to PowerShell? There’s an easy way to find out, let’s run a control test.
We’ll conduct the same test but instead of running the second script against the secondary, we’ll run it on the primary. Doing that, we’d expect zero latency.
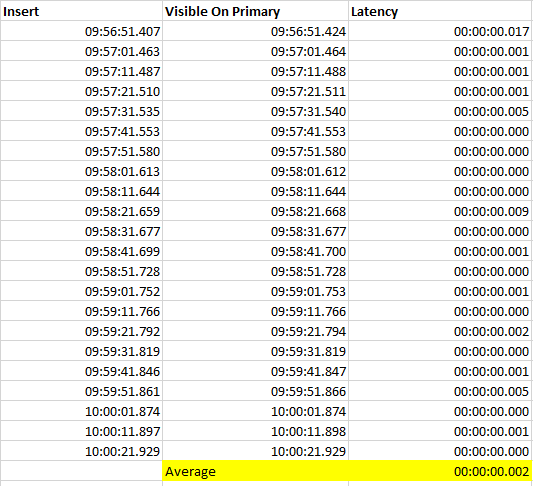
When doing that we see a latency average of just 2ms.
So I think we can be pretty confident with the results of our initial test and be happy that it was taking around 500ms for the data, once committed on the primary to become visible in the tables on the secondary.
Conclusion
While 500ms is a fairly long time in the world of computers, 99% of the time I doubt it’s likely to be an issue for your reporting workloads.
However, if your reports are that time sensitive you may find that this is something that you might want to be aware of.
In the situation that I recently came across, the developers had written a mechanism that allowed reports to be run in bulk batches. The application would update a ‘bulk reports’ table with details of a number of reports that needed to run. Then, using a read only intent connection, it would read the ‘bulk’ table and execute the required reports. The problem here came because the application would update the ‘bulk’ table and then immediately read the corresponding table on the secondary. Unfortunately, because of redo latency, it would return no rows and the reports would fail to run.
Thanks for reading and hopefully you’ve found this interesting.
