If you need to keep track of CPU and are not fortunate enough to have a monitoring tool to keep hold of historical CPU usage then this module may just be for you, you can find the code on GitHub.
New to the Inspector? be sure to check out the Introducing Inspector post first.
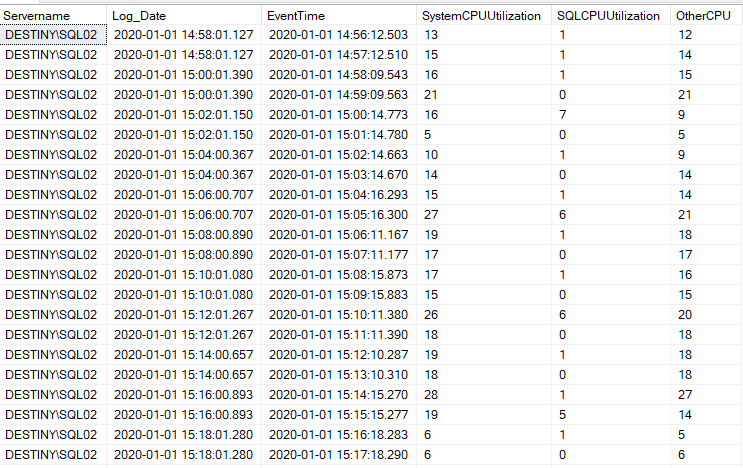
We have put together a custom module for Inspector V2 that will go and collect the latest CPU % for total CPU% , SQL Util % and Other CPU % every two minutes (configurable) and log this information to the table Inspector.CPU
Data sample:
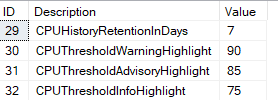
There is also a report proc scheduled with your Default ModuleConfig too which will show CPU information if greater than the thresholds stored in the Inspector.Settings table.
CPUThresholdWarningHighlight – set to 90 by default
CPUThresholdAdvisoryHighlight – set to 85 by default
CPUThresholdInfoHighlight – set to 75 by default
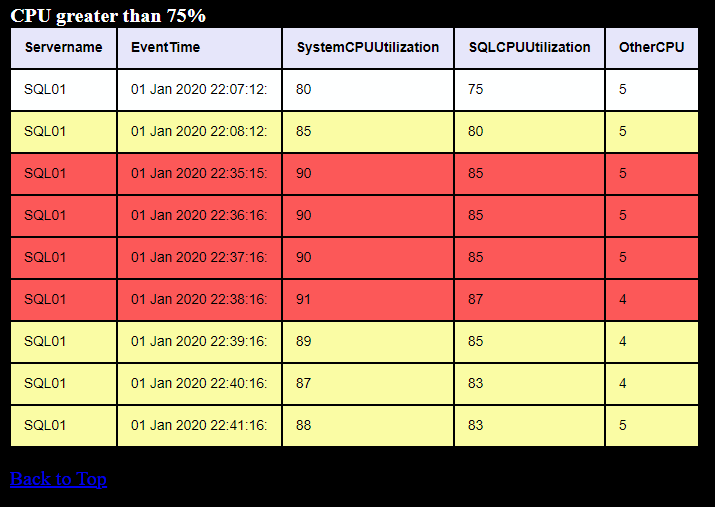
If the CPU % is greater than CPUThresholdInfoHighlight then the CPU% will then be evaluated against all three of the threshold values and banded accordingly with highlighting as below:
The Report will only look back as far as the Frequency you have scheduled, for example if the report is running on a 2 hourly schedule (120) then @Frequency = 120 this would be reflected in the where clause as EventTime > DATEADD(HOUR,-@Frequency,GETDATE()) so you should only see information relevant to that time frame.
History retention in days can be set in the Inspector.Settings table using CPUHistoryRetentionInDays this setting will keep the data within the Inspector.CPU table within your managed time frame,
Below is a sample of the output.
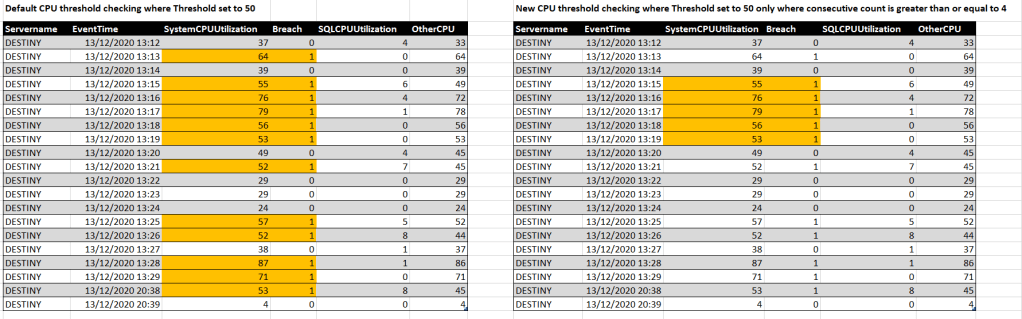
Newly added:
We recently added consecutive count threshold, this allows you to control when you receive the reports not only based on % utilisation but also the minimum consecutive occurrences (CPUBreachedConsecutiveCount) above the CPUThresholdInfoHighligh setting, for example:
Prerequisites:
Install SQLUndercover Inspector V2.
Installation Instructions:
- Download Inspector_CPU_CustomModule.sql from Github
- Use your logging database where you have the Inspector Installed and execute the code
Installation defaults:
- CPU Collection runs every 2 minutes under your Default ModuleConfig
- The Report for CPU will be combined with your Default ModuleConfig report.
You can of course change from the Default ModuleConfig and have the CPU module run off its own ModuleConfig and report on that separately if you wish.
