
Page Updated: 23/07/2021
Current changes:
Inspector V2.6 changes (including V2.5)
Previous changes:
Inspector V2.4 changes
Inspector V2.3 changes
Inspector V2.2 changes
Inspector V2.1 changes
Inspector V2 changes
Inspector V1.4 changes.
Inspector V1.3 changes.
Inspector V1.2 changes.
Custom modules:
BlitzWaits
BlitzFileStats
CPU
Introducing: The SQLUndercover Inspector! now available on GitHub but what exactly is it?

The All new Inspector gives you the power to Create, configure and schedule SQL modules, control when modules execute and control when reports are produced/emailed.
It’s completely open source under MIT licence , we would love to hear from you with your suggestions and improvements.
You can find our GitHun Repo here and we have a dedicated channel over on Slack in the SQL community #sqlundercovertools
When you install the Inspector you will get some default modules:
ADHocDatabaseCreations
AGCheck
AGDatabases
BackupsCheck
BackupSizesByDay
BackupSpace
DatabaseFiles
DatabaseGrowths
DatabaseOwnership
DatabaseSettings
DatabaseStates
DriveSpace
FailedAgentJobs
JobOwner
LoginAttempts
LongRunningTransactions
ServerSettings
SuspectPages
TopFiveDatabases
UnusedLogshipConfig
Instance Version/Edition changes
All of these modules can be enabled/disabled as required, most of these modules have been around throughout V1 but this time around what we really wanted to do was offer the ability to create your own modules so that you can collect your own data , schedule it and if you want to you can report on it.
We will be offering our very own custom modules as add ins which will be available as separate sql files that you can install.
So how does it work?
It is all driven from a SQL agent job which runs on a schedule every minute, each time the job runs it will look for Servers in the CurrentServers table and Module schedules that are due (collections) from the Modules table, it will also check for any Reports (ModuleConfig) that are due and execute accordingly.
Scheduling basics

Modules can be found in the Modules table, here you can set schedules for existing modules or add new ones that you can code yourself. The Modules table allows you to specify the Start time and End time for your collection to create a run window i.e StartTime – 09:00, EndTime – 18:00 , you will also be able to specify a frequency in mins too e.g 1440 for once a day or any other number between 1 and 1440 to represent minutes within the time window specified. Schedules within this table only control execution of the collection stored procedure for that row.

The ModuleConfig table works exactly the same except this table is used to determine report schedules, there are a couple of other configurations here too such as ShowWarningsOnly, so if you only want the report to email out when there is a WarningLevel 1 present then switch that to a 1. Schedules in this table only control Report stored procedures within the Modules table where the ModuleConfig_Desc matches the ModuleConfig_Desc in the ModuleConfig table.


Warnings and Thresholds
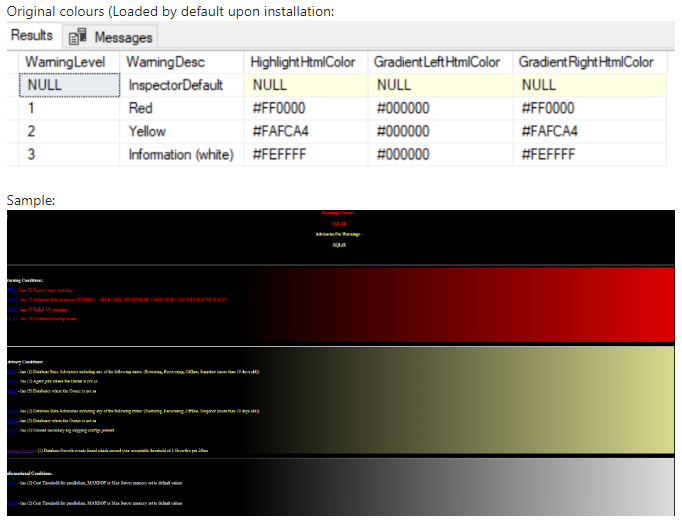
In the Modules table you will find a WarningLevel column, this column can have a value of 1-3 which controls the highlighting of rows within the report for a given module and also the header generated at the top of the report to point out that a warning/advisory condition is present, by default the warning levels are:
1 – Red
2 – Yellow
3 – White

These colours can be changed for any html hex colour in the ModuleWarnings table, you can also change the gradient colours in the header too!


Configurations and Customisation
The Inspector offers plenty of configuration and customisation options , check out the settings table for threshold values and change them to suit your needs and add your own if you need them!
Need to change the email recipient or the email subject? there are corresponding tables for those: Inpector.EmailRecipients and Inspector.EmailConfig
Do not like the Red, Yellow, White Warning/Advisory scheme? go ahead and change it!
Do not like the Module heading text? Change it in the Modules table using the HeaderText column.
Fed up of seeing tables stating that there are no issues present? Go ahead and suppress those tables from showing in the ModuleConfig table using the NoClutter column.
Do not like the order in which the modules are displayed? Update the Modules table and set the ReportOrder column as required.
We want you to have as much control over the tool as possible so that you can have it your way.
Create your own modules
Create you own modules – you have three options available when you create your own module.
Collect data only
Report on data only
Collect and report on the data
There are a few steps to get your custom module added, here is a quick overview of what you will need to do.
Create a table:
Create a table to store your data in the Inspector schema, the table must include these columns:
Servername NVARCHAR(128) NOT NULL – Populate with @@SERVERNAME
Log_Date DATETIME NOT NULL – Populate with GETDATE()
and then add any other columns you need.
Create your collection stored procedure:
Create your collection stored procedure in the Inspector schema to populate the table you created
Create your report stored procedure
Create your Report procedure in the Inspector schema ,use the template proc “ModuleReportProcTemplate” to help you with required syntax.
Insert schedule/config rows
Insert a row into Inspector.Modules and Inspector.ModuleConfig tables as required.
And the rest is taken care of.
Track what the Inspector has been doing
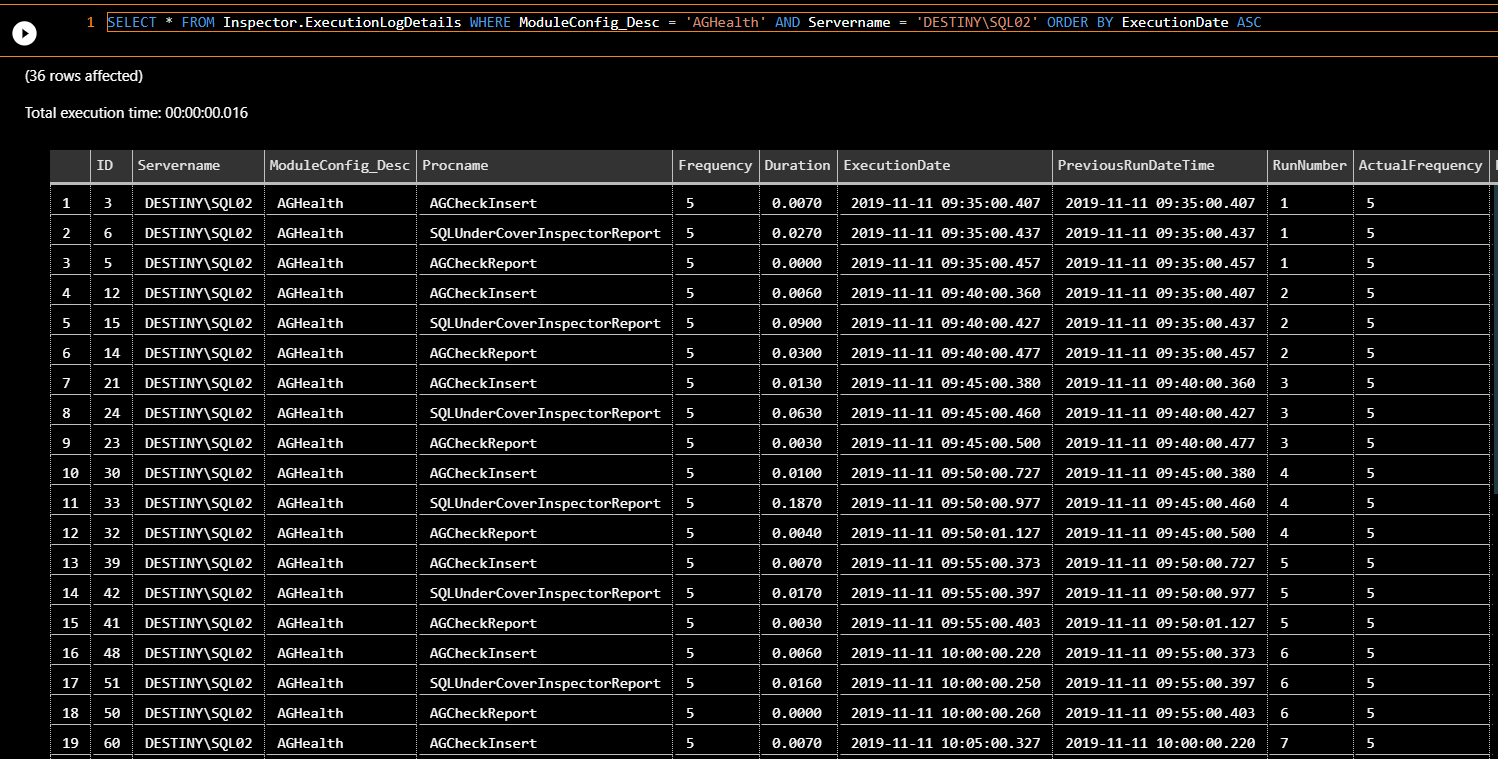
To see what the Inspector has been executing query Inspector.ExecutionLog this will show which procedures have been executed , when and their duration. For a more detailed output query the view Inspector.ExecutionLogDetails which will show you schedule frequency information, run number and the actual frequency.
Included modules
Instance Version/Edition changes – notify you of any changes to the Edition of SQL, Major version or Minor version, this information is stored within the database to allow you to check back at any time to see when these changes were identified by the collection. If changes are detected then these changes are reflected in the report.

ADHocDatabaseCreations – Checks for any databases that have been created in the last 7 days which include numerics in the database name or keywords ‘Restored’ or ‘Copy’ , any databases found matching the above criteria will be highlighted in yellow (configurable) and show an advisory condition shown at the top of the report.
AGCheck – As with all modules in the Inspector you can control the warning level which will determine the highlighting colours used in the report, This module will check:
Health of availability groups – The health of your availability groups and produce a warning/advisory if any Availability group is unhealthy.
Failover ready node count – Failover ready check for the AG Check module, the failover node count that you consider as being failover ready per AG can be set within a new configuration table [Inspector].[AGCheckConfig], if the total failover ready node count for an AG is less than that specified in the config table then a Warning/Advisory is shown on the report. When you specify a failover ready count of 10 or more this is then considered a percentage based node count therefore the count is determined by the the percent of replicas within the AG
AG Failovers – If a failover has occurred since the last Inspector collection the new primary will be inserted into a new history table [Inspector].[AGCheckConfig] and a Warning/Advisory (Based on your warning level config for AGCheck module) will be shown on the report


AGDatabases – If you are using Availability groups and you have this new module enabled the Inspector will assume that all databases should be joined to an AG, every database name for the instance is inserted into a new table called [Inspector].[AGDatabases] and the Is_AG flag is set to a 1 , if databases are joined to an AG then the Is_AGJoined column is set to a 1 therefore no Advisory will be shown on the report. If a database is marked as Is_AG then it will continue to warn if not joined to an AG on the Inspector reports, if you wish to exclude a given database from the advisory condition simply update Is_AG to a 0 .
Instances that are not Hadr enabled with at least one AG will automatically have Is_AG set to 0 and will be excluded from the checking even if the module is enabled.


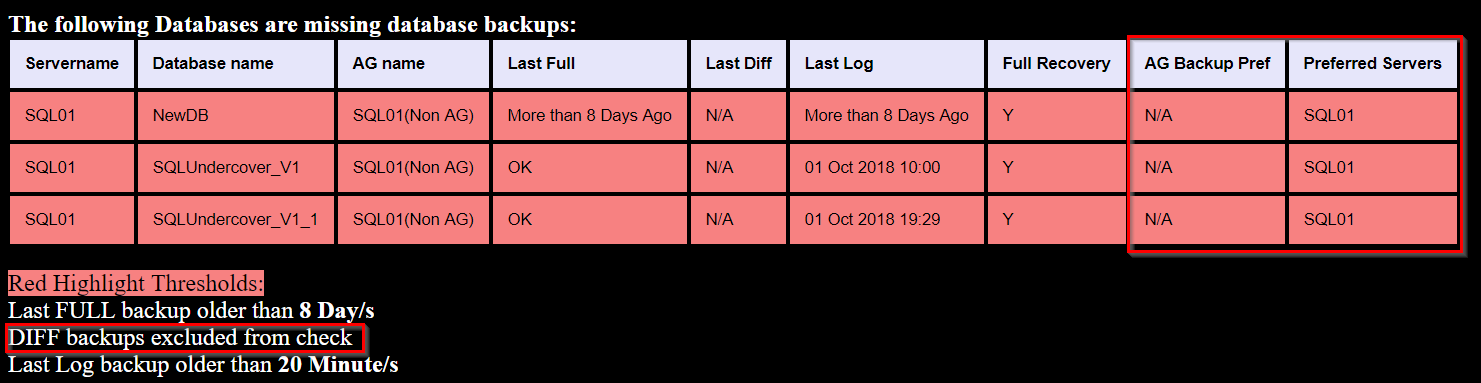
BackupsCheck – Check all backups for all databases including system databases (not TempDB) , compare the last backup dates for FULL, DIFF and LOG against the thresholds set in the Settings table, if there are any breaches then Highlight affected database/s in Red and Show a Warning Condition at the top of the report. If you take transaction log backups from Secondary replicas then the backupscheck will handle this too as long as you are running the collection on all servers taking backups and you are centralizing your collections to a central database. AG Backup Pref will show the Automated backup preference at the time of collection for the given AG (N/A for non AG) and the preferred servers column will show only the relevant server/s which are able to take transaction log backups.

BackupSizesByDay – Show total backup size for Server/s broken down by Day of the week.

BackupSpaceCheck – Checks the space available on the backup drive specified in the settings table against the total estimated backup size required for the next 24 hour period, if there is insufficient space then the information will be highlighted in red (configurable) and a Warning condition shown at the top of the report. *
*This module uses xp_cmdshell therefore it is possible to check a UNC path, multiple backup paths can be specified in the Inspector.Settings table.
DatabaseFileCheck – Checks for Data Files on the Log drive and Log files on the Data drive, these drives are configured by the user during the Inspector setup. If any discrepancies are found then a Red warning condition will be added

DatabaseGrowthCheck – Checks database data file sizes at collection versus sizes when last logged 24 hours ago , if the total growth increments exceeds the allowable growths per day threshold then you will see the file information highlighted in yellow and an Advisory condition is shown at the top of the report . If the total growths for a given file exceeds your maximum allowable growths threshold then the file information is highlighted in red and a Warning condition show at the top of the report. All growths are logged to the DatabaseFileSizeHistory table.

DatabaseOwnership – Checks database ownership and reports if the owner differs from your preferred owner list in the Inspector.Settings table.

DatabaseSettings – Collect counts for Database settings for the following database settings:
Database Collation
Is_Auto_Close_On
Is_Auto_Shrink_On
Is_Auto_Update_Stats_On
Is_Read_Only
User_Access_Desc
Compatibility_Level
Recovery_Model_Desc
Yellow Advisory conditions are set to show if any of the following occur:
Is_Auto_Close_On = Enabled
Is_Auto_Shrink_On = Enabled
Is_Auto_Update_Stats_On = Disabled
DatabaseStates – Checks the States of all databases listed in sys.databases plus snapshot information , there are a few criterias for conditions based on the states as follows:
Yellow Advisories (configurable):
Restoring, Offline, Database Snapshots (more than 10 days old)
Red Warnings:
Recovery_Pending, Suspect, Emergency

DriveSpace – Shows Drive information for drives which contain databases only, Total capacity, Free space , Average daily data usage and the last five days usage.*
*Daily usage calculation has two modes, Average based calculation or Median based Calculation.

FailedAgentJobs – Check for failed agent jobs in the last 24 hours that have not succeeded since, any failures will be highlighted in Red and a Warning shown at the top of the report.

JobOwner – Checks SQL Agent jobs to ensure that all Job ownership matches the login/s in the settings table , any jobs which have a different owner are highlighted in yellow (configurable) and an Advisory condition shown at the top of the report

LoginAttempts – Shows information on failed logins in the past 24 hours, shows the login name, failed count , last failed date time and the last error produced (No conditions apply to this module this is for informational purposes only)

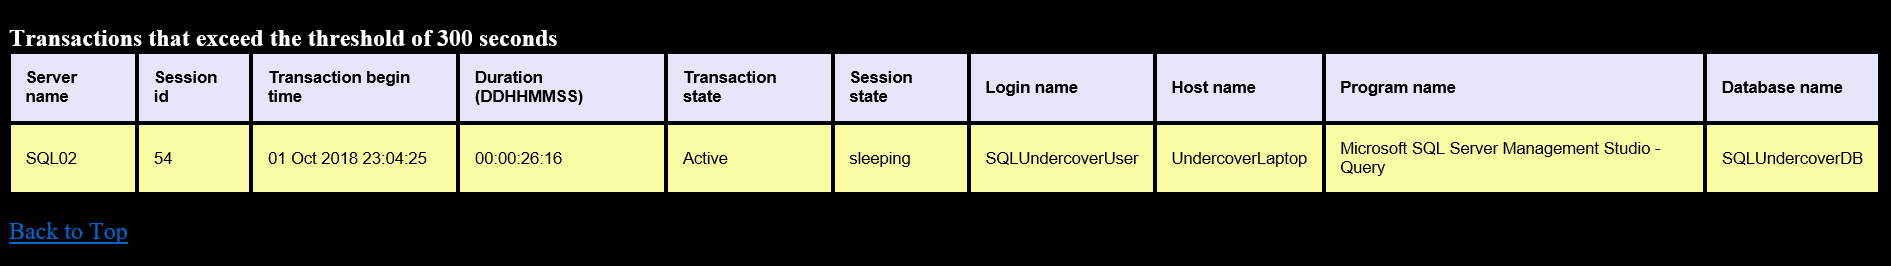
LongRunningTransactions – The threshold for long running transactions in seconds can be found in the [Inspector].[Settings] table.
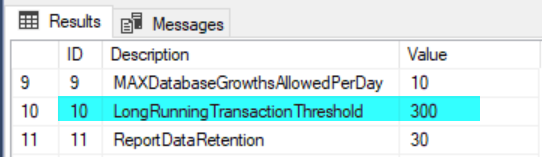
This setting is the threshold in Seconds, if a transaction exceeds this duration at the time of collection the Report will show a Yellow advisory condition and show some details of the transaction.
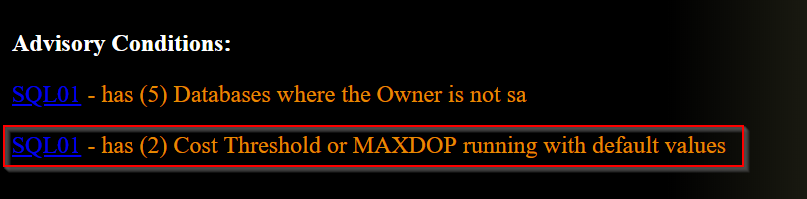
ServerSettings – A Selection of server settings are shown on the report as information only however warnings are shown if Default cost threshold or MAXDOP are set to default values.

SuspectPages – If suspect pages have been recorded in msdb , a warning is shown at the top of the report and details contained in a table like below


TopFiveDatabaseSizes – Shows Database name and Size for the Top 5 Databases on the server ordered by Largest first (No conditions apply to this module this is for informational purposes only).

UnusedLogshipConfig – Check if you have log shipping config present for a database that is either not in a restoring state or no longer exists.
Sometimes Log shipping configuration sits around and doesn’t get cleaned up and the database is either online or no longer exists, its nice to have this tidy so that it is not misleading when querying the dmvs for log shipped secondaries.
Views/Procedures for analysing data.
Views:
[Inspector].[DriveSpaceInfo] – Average growth details for Daily, Monthly and Yearly and also the Minimum growth there has been for a single day over the period and the Maximum growth for a single day within the period.

[Inspector].[DatabaseGrowthInfo] – Aggregated database file growth information for recorded growths within the Inspector, shows actual size growth and some Average based predictions for Daily, Monthly and Yearly growth sizes.

Procs:
[Inspector].[DriveCapacityHistory] – Get information from the data colected by the DriveSpace module that will show you when your Drive/s had their capacity increased.

