Post Updated: 23/07/2021
Here is a quick guide to getting started with the SQLUndercover Inspector.
So you have ran through the installation of the Inspector and now you want to know what to do next, below we will guide you through some of the key steps to get you started and following on from that we will explain how you can configure the Inspector to get things working how you want them.
Once you install the Inspector you will find that you have a new Schema called Inspector in the logging database you chose when you installed, within this schema you will find a bunch of tables, views and stored procedures that have been created upon installation along with 1 new SQL Agent job (Inspector Auto [Inspector DB name]).
First thing to do:
Check the Agent job is running successfully, it runs once a minute checking for Modules/Reports that are scheduled to run from the Modules table and ModuleConfig table.
To see what’s going on you can query the Inspector.ExecutionLog table this will show you history runs for today only:
SELECT *
FROM [Inspector].[ExecutionLog];
Otherwise for collections you can check the LastRunDate column in the Inspector.Modules table, and for Reports check the LastRunDate column in the Inspector.ModuleConfig table.
SELECT *
FROM [Inspector].[Modules];
Check you setup email recipients:
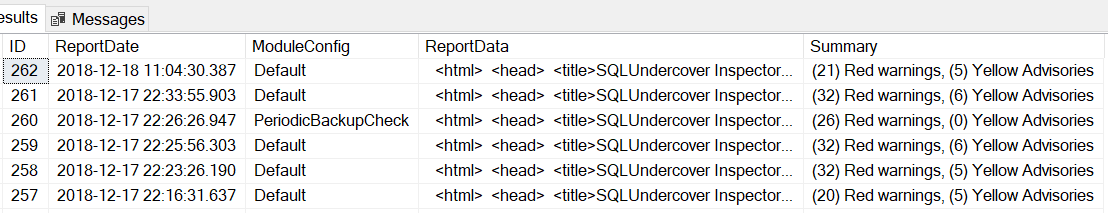
If there was no email address specified in [Inspector].[EmailRecipients] you will not receive and email but you will be able to retrieve the HTML report from the [Inspector].[ReportData] table.
Check your schedules
Go and query the Inspector.Modules table to see which module collections will run, the frequency they will run on and the collection timeframe that they will run in. Query the Inspector.ModuleConfig table to see the report schedules and other options.
SELECT *
FROM Inspector.ModuleConfig;

SELECT *
FROM Inspector.Modules;
Changing Global settings:
You will find a bunch of global settings in the [Inspector].[Settings] table
SELECT [ID]
 ,[Description]
 ,[Value]
 FROM [Inspector].[Settings]

That’s a quick start but for a more detailed guide check our dedicated user guide page.
For more details about scheduling and various features introduced in V2 visit the Inspector V2 page
